In my post on avoiding home-country bias in the Philippines, I mentioned the BPI Invest Global Equity Fund-of-Funds UITF (BPIGLBL:PM) as one of the options in diversifying into international stocks. This fund aims to “provide excess return” over its benchmark, the MSCI World Index, which covers international developed markets.
In June 2019, a number of news articles came out saying that the BPI fund has exceeded $100M in assets, and is now the largest of its kind in the Philippines:
- BPI Global Equity Fund tops $100 M, PH’s largest
- BPI AMTC’s UITF surpasses $100M in assets under management in Q1
- BPI AMTC global fund breaches $100M
These articles also mention BPI’s claims that its fund has consistently outperformed the benchmark MSCI World Index: “It overtook the returns registered by MSCI World Index – comprised of large and mid-cap equities of 23 developed markets such as United States of America, United Kingdom, Japan, Hong Kong, and Singapore – by 0.94% (year-to-date)to 2.58% (two-years) as of the first quarter of 2019.” This is a pretty bold and impressive claim. But is it true?
First, let’s get to know BPI’s fund in detail. It’s fees are as follows:
| Trustee Fees | 1.50% |
| Custodianship Fees | 0.0026% |
| External Auditor Fees | 0.0039% |
| Total | 1.5065% |
That trustee fee is the highest among the locally available global equity UITFs.. Now, the BPI UITF intends to beat the MSCI World Index. If it just wanted to track it, it could have simply chosen to use a single target fund like the iShares MSCI World ETF URTH which tracks the MSCI World Index. Instead of using only one target fund, BPI’s global equity fund is a fund-of-funds, meaning it invests in a portfolio of funds. Unlike the passive nature of feeder funds, not only do the BPI fund managers have to choose the global funds it wants to invest in, they have to decide on how to allocate them in its portfolio. Is this active management component how the fund justifies its high trust fee in its aim to beat the benchmark?
Let’s look at the fund’s top holdings as of October 31, 2019. I also added the total expense ratio (TER) or ongoing charges figure (OCF) for each fund if available from Morningstar.
| name | % of holdings | ter/ocf |
|---|---|---|
| Wellington Global Quality Growth Fund | 47.68 | 0.85% |
| SPDR S&P 500 ETF | 20.57 | 0.095% |
| Wellington Strategic European Fund | 11.34 | 1.85% |
| Wellington Global Health Care Fund | 6.29 | 1.97% |
| Capital Group New Perspective Fund | 5.63 | 1.63% |
| BOCH Deposit | 1.92 | |
| UBS Global Emerging Market Opportunity Fund | 1.50 | 0.83% |
| CHIB Time Deposit | 1.30 | |
| Wells Fargo Emerging Market Income Fund | 1.02 | 1.26% |
The previously quoted 1.50% BPI fund trustee fee is on top of these component funds’ hefty fees. Only the SPDR S&P 500 has a low expense ratio. Even though BPI’s global fund aims to beat the MSCI World index, it did not limit itself to that index’s asset class of developed markets. Its top holding, Wellington Global Quality Growth Fund, actually tacks the MSCI ACWI Growth index, which also includes emerging markets. Furthermore, it also has holdings in other emerging market and China funds.
The resulting allocation by geography according to its October 31, 2019 disclosure is as follows:
| REGION/ASSET | ALLOCATION |
|---|---|
| North American equities | 60.43 |
| Japan equities | 1.65 |
| Asia Pacific/Other Emerging Market Equities | 9.14 |
| Europe Equities | 23.83 |
| Other: Cash and equivalents | 4.95 |
We can compare that the geographical allocation of the MSCI World Index:
| MSCI WORLD COUNTRY | MSCI WORLD WEIGHT |
|---|---|
| United States | 62.82% |
| Japan | 8.4% |
| United Kingdom | 5.47% |
| France | 3.84$ |
| Canada | 3.39% |
| Other (Switzerland, Germany, Australia, Netherlands, Hong Kong, etc.) | 16.07% |
As expected, there are geographic weighting differences, with the BPI fund a little underweight with North America, and a lot underweight with Japan. Additionally, the BPI fund includes China equities which the MSCI World Index definitely does not cover.
Now that we know enough about the BPI Invest Global Equity Fund-of-Funds UITF, let’s examine the claim that it has achieved its goal of outperforming the MSCI World Index. From the October 31, 2019 disclosure:
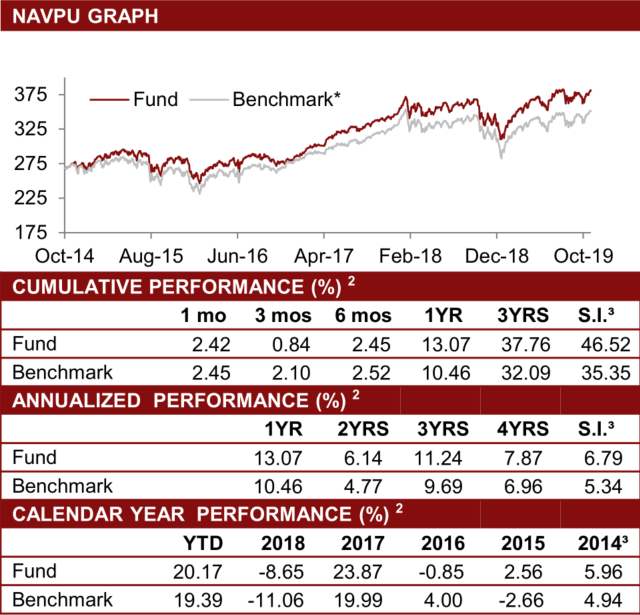
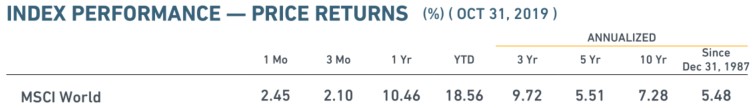
I was able to double-check the Cumulative Performance (%) numbers for the benchmark from the MSCI World Index – Price Returns fact sheet for October 31, 2019.
I am not sure, however, where the the BPI fund fact sheet’s Calendar Year Performance (%) numbers for the MSCI World Benchmark comes from. They differ from the annual numbers from the MSCI World Index fact sheet was:
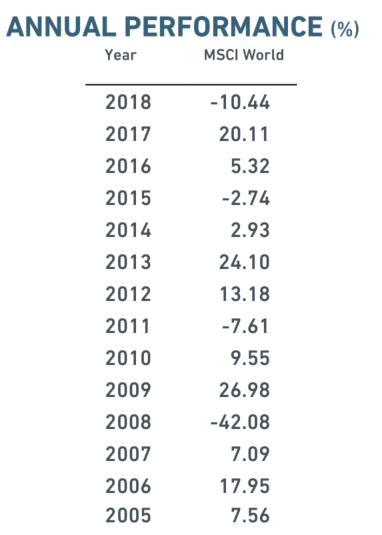
The given benchmark calendar year performance from the BPI KIIDS do not match the Annual Performance numbers from the MSCI World fact sheet. I can’t find a valid reason for this mismatch.
In any case, the cumulative numbers appear to match, and indeed, the BPI fund appears to outperform the MSCI World index. We can compare the BPI fund’s performance with iShares URTH, which directly tracks the MSCI World Index:
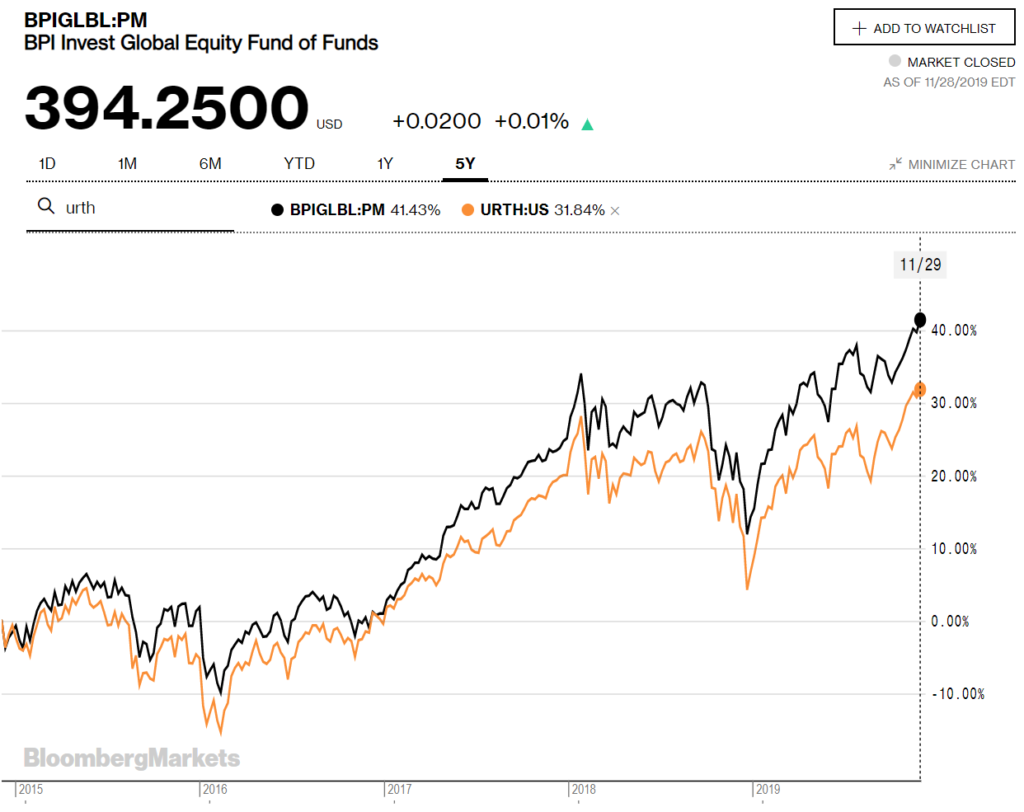
The BPI global fund’s 5-year return is 41.43% compared to URTH’s 31.84%. Impressive? Unfortunately, this is not the complete story. The situation is very similar to what I discussed in the post – Is it worth investing in a US Equity Index feeder fund from the Philippines? – where I compared the performance of BPI’s US equity feeder fund versus the performance of the SPY ETF it tracks.
When MSCI reports the performance of its indices, it reports three sets of numbers:
- Price returns – based simply on the price of constituent stocks, without accounting for dividend distributions
- Gross returns – assumes dividends are reinvested into the index
- Net returns – assumes dividends, net of maximum possible withholding tax rates, are reinvested
Without accounting for dividends, the price returns would be the smallest of the three, while gross returns would yield the largest numbers. Since both dividends and taxes are accounted for in net returns, net returns is typically in between price and gross returns. The different returns for MSCI World are as follows:
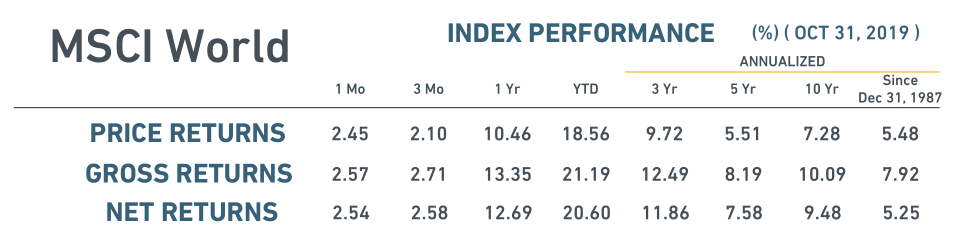
The BPI Invest Global Equity Fund-of-Funds UITF is actually comparing itself to the MSCI World Index’s price returns, but the BPI fund is an accumulating fund, since it does not distribute the dividends it receives from its portfolio of funds. Saying that the BPI fund is outperforming MSCI World’s dividend-less price returns is a little bit dishonest. The above comparison with the URTH ETF is actually an incomplete picture, since URTH distributes dividends with a 5-year average dividend yield of 2%.
The BPI Fund’s 1-year cumulative return of 13.07% actually compares favorably with the 12.69% 1-year net return. Remember though that net returns assumes that the maximum withholding tax rates are applied to dividends before they can be reinvested. No self-respecting fund manager will pay the maximum tax rates. IWDA is an accumulating iShares ETF, domiciled in Ireland, that tracks the MSCI World Index. Being based in Ireland, it has a favorable 15% dividend rate for US stocks as opposed to the maximum 30% rate. Let’s compare how BPI’s fund compares with IWDA:
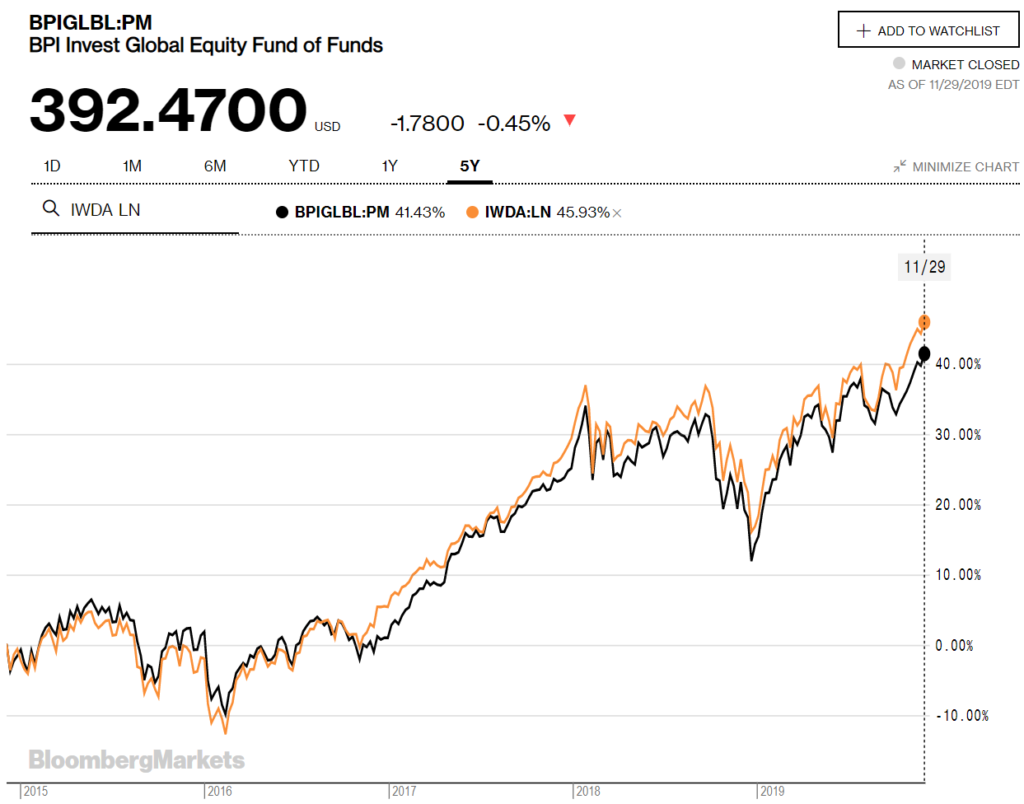
IWDA’s 5-year return is 45.93% beats BPIGLBL’s 41.43%. So accounting for dividends, the BPI fund’s actively chosen portfolio of funds DOES NOT beat the performance of an accumulating ETF that directly tracks the MSCI World Index.
Summary
- BPI Invest Global Equity Fund-of-Funds UITF intends to outperform the MSCI World Index
- The MSCI World Index covers stocks developed markets. The BPI fund also invests in emerging market funds.
- The BPI fund indeed appears to beat MSCI World Index Price Returns which does not account for dividends. This, however, is an incomplete comparison.
- Accounting for dividends, an accumulating ETF like IWDA that directly tracks the MSCI World Index still beats the BPI fund’s returns.