(Note: This is not a personal finance-related post. I’ll be back to regular programming shortly.)
It’s been quite a while since my last post on March 1, 2020. At that time, there were only 91,000 confirmed COVID-19 cases worldwide and only 3 in the Philippines. Only China and certain parts of Italy had imposed lockdowns. Since then, the pandemic has exploded worldwide with millions of cases, several hundreds of thousands dead, and quite a few economies in recession.
The Philippines has been in various levels of lockdown since the middle of March. During this time, the Filipino penchant for coming up with an alphabet soup of initialisms is in full display: ECQ, GCQ, MGCQ, MCQ, LSI, APOR. Compared to some of its Asian neighbors, the Philippines has not fared well in terms of the number of cases and fatalities.
Each day, typically around 4 p.m., the Philippine Department of Health (DOH) releases new confirmed numbers for the day. The DOH later releases what they call a data drop consisting of data files containing case, testing, and medical facility capacity information for the day. I’ve decided to see for myself what the DOH discloses in these data files.
The numbers so far as of August 18, 2020.
| New | Total | |
| Cases | 4,836 | 169,213 |
| Deaths | 7 | 2,687 |
| Recoveries | 182 | 112,861 |
Daily announced numbers are just the cases the DOH has confirmed.
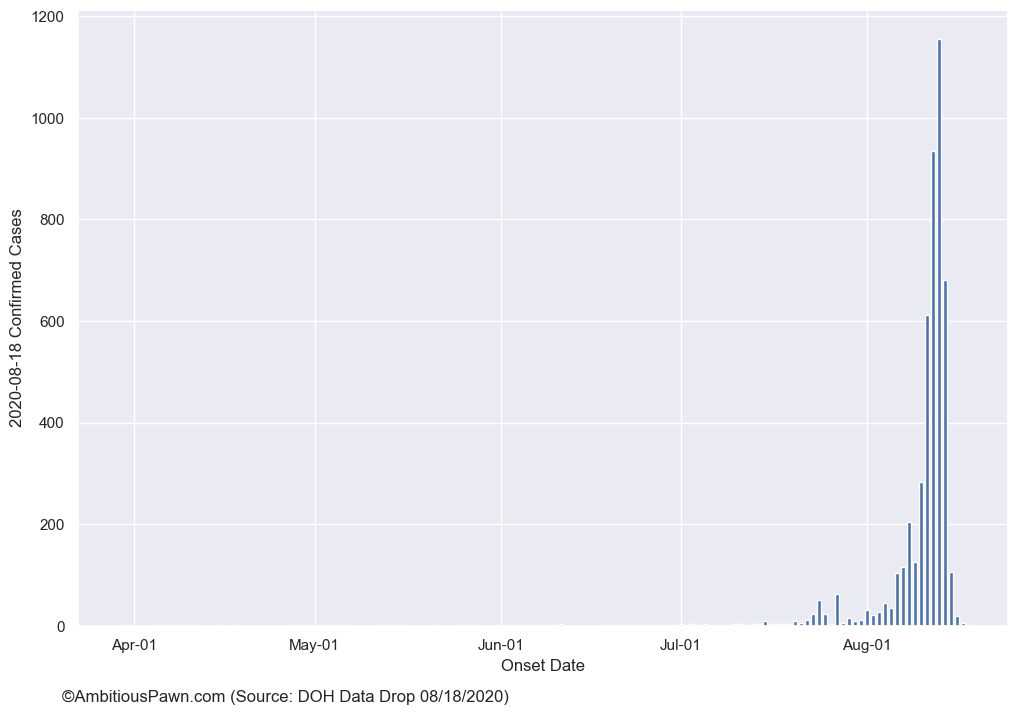
I think this has been made clear several weeks ago when the DOH started to distinguish between “fresh” and “late” cases. They have since stopped making this distinction in more recent announcements, but it is still the case that for each new batch of numbers announced everyday, some cases date back to several days or weeks ago. For the 4,836 new cases confirmed on August 18, the chart below shows the distribution of onset dates. Most cases were from the first half of August, and some from July. (Note that in the DOH data files, not all cases have recorded onset dates. In these cases, the date of specimen collection is used as proxy).
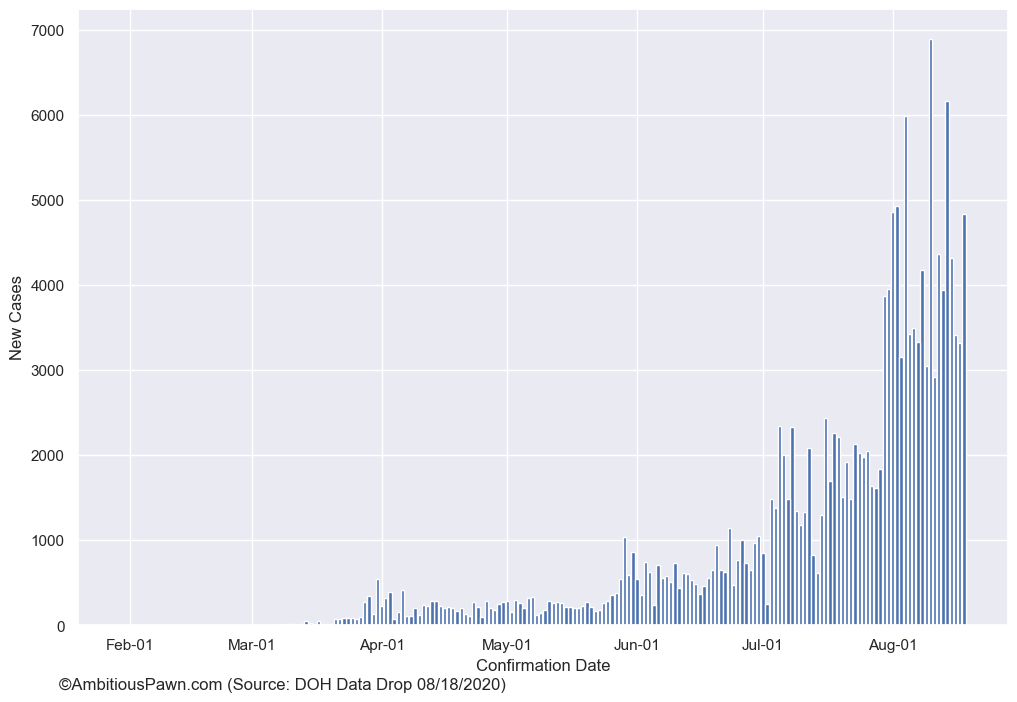
Obviously, the number of new cases announced each day is a function of how efficient the DOH is able to confirm new cases. There is still a significant backlog of cases that are pending validation as I’ll show below. So, if one day, the DOH announces 10,000 new cases — which would be a new record — it’s not necessarily time to panic even though media outlets will find it hard to resist to sensationalize this number. It’s also not necessarily time to declare victory if, one day, the DOH suddenly announces only 500 new cases after several days of >3000 daily cases. To repeat, the new daily confirmed case numbers do not necessarily reflect the growth or decline of the pandemic.
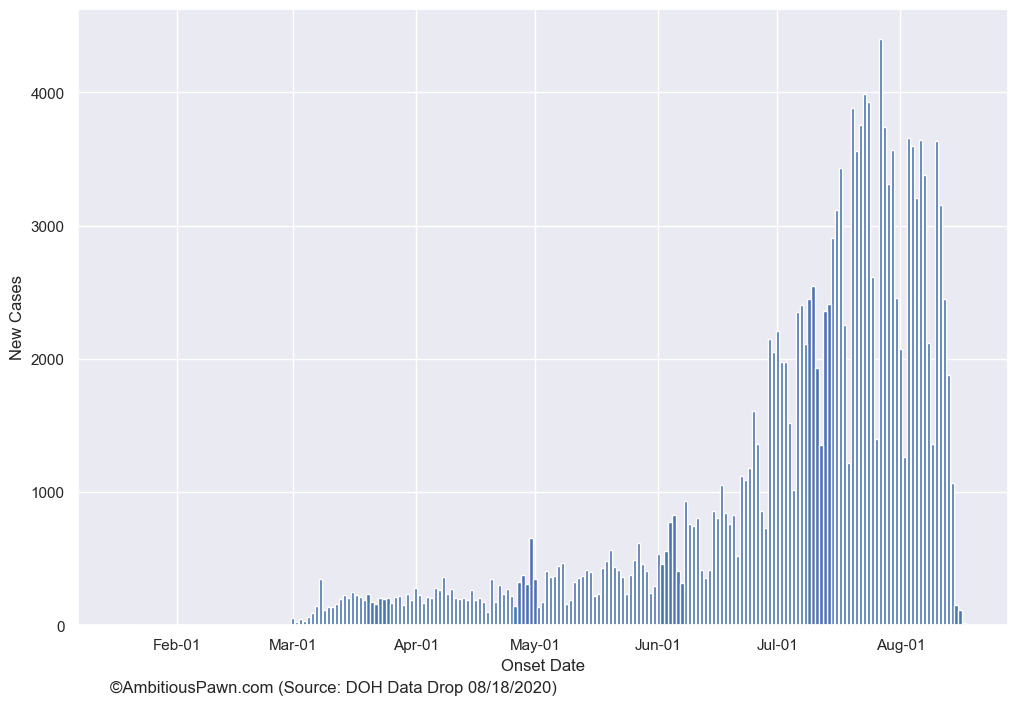
A better, but still incomplete, way of looking at the epidemic curve is by plotting the cases by date of onset as shown below. While the plot based on confirmation date shows a couple of days with 6000+ new cases, we can see from the plot below that, based on the date of onset, we haven’t seen a 5000+ day. That might change later on as pending cases are validated.
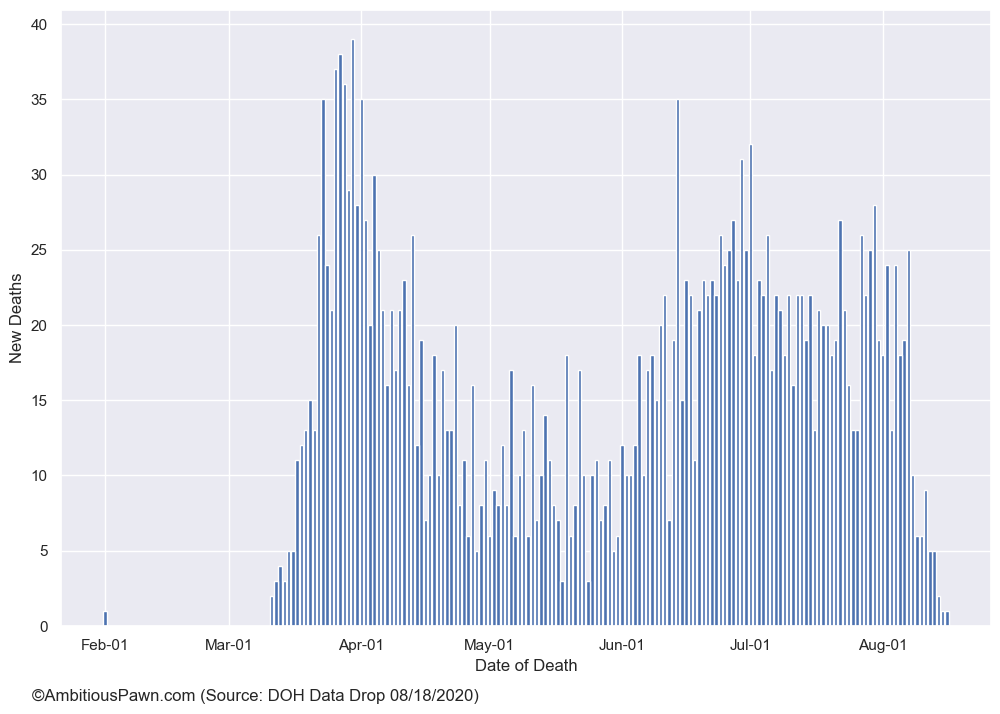
The same is true with the the number of deaths. On July 12, 2020 the DOH announced 162 confirmed deaths. If we look at the plot of deaths by date shown below, we haven’t had a day with 50+ deaths. This does not necessarily mean that we’re doing well. I think it’s just important to put the numbers in context.
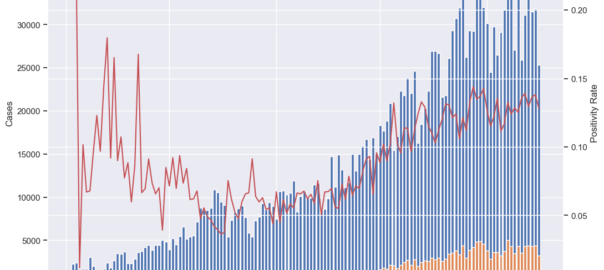
While testing capacity has increased, positivity rate is still above 10%.
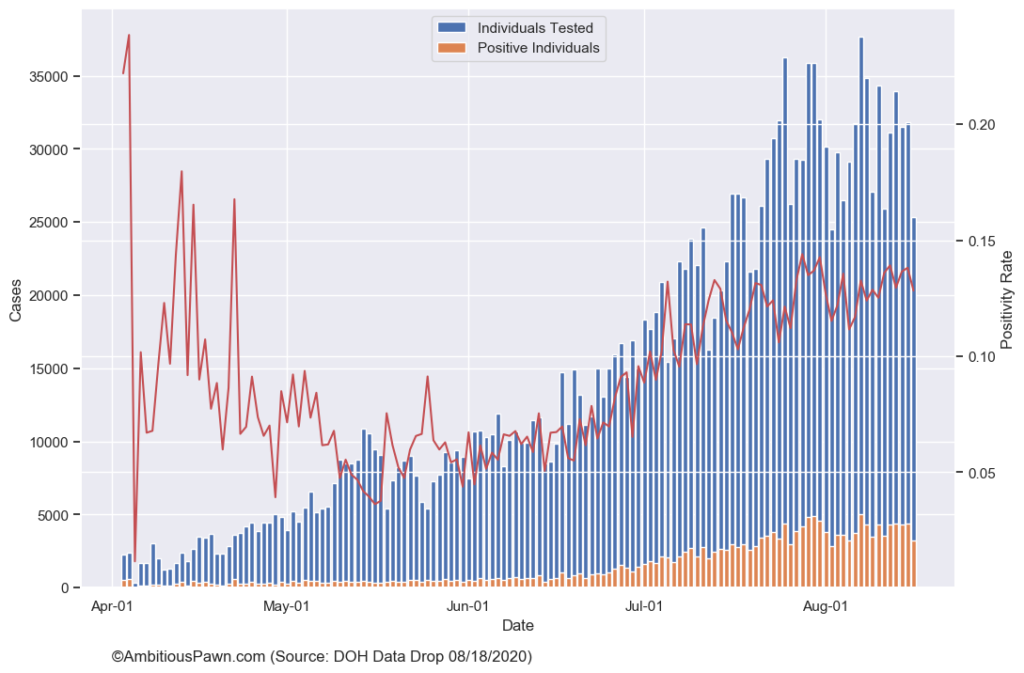
The DOH daily data files include the number of tests performed and number of positive test results each day from the different accredited testing centers around the country. While the testing capacity has definitely improved, the positivity rate has remained above 10% for the past month or so.
There is still a significant number of positive test results that are pending validation.
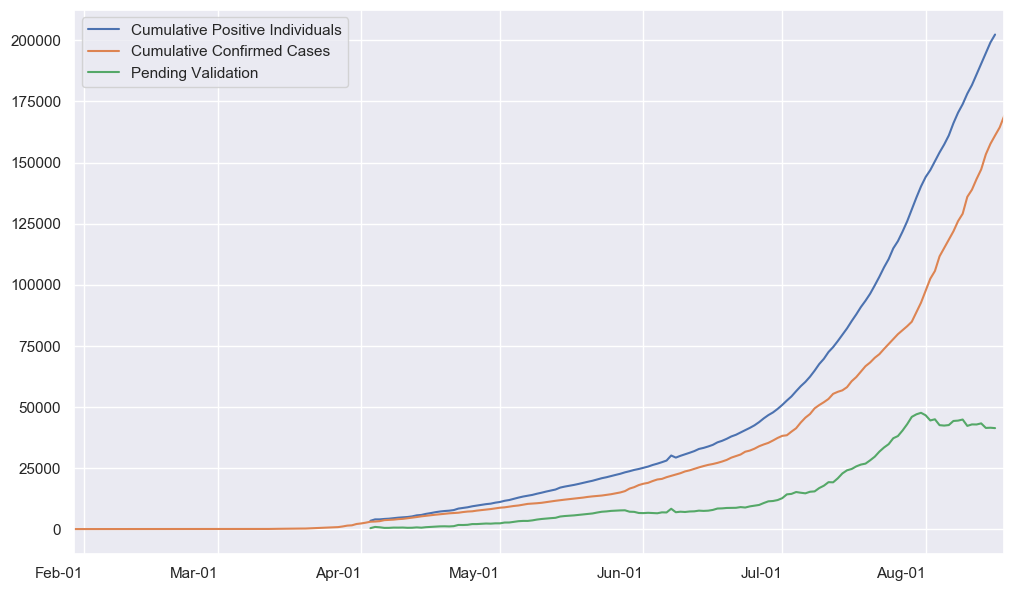
The plot above shows that there are still around 40,000 positive tests pending validation. The good news is that the backlog has stopped increasing around late July. This could mean that the DOH has ramped up its validation rate or the rate of new positive test results have plateaued or slowed down.
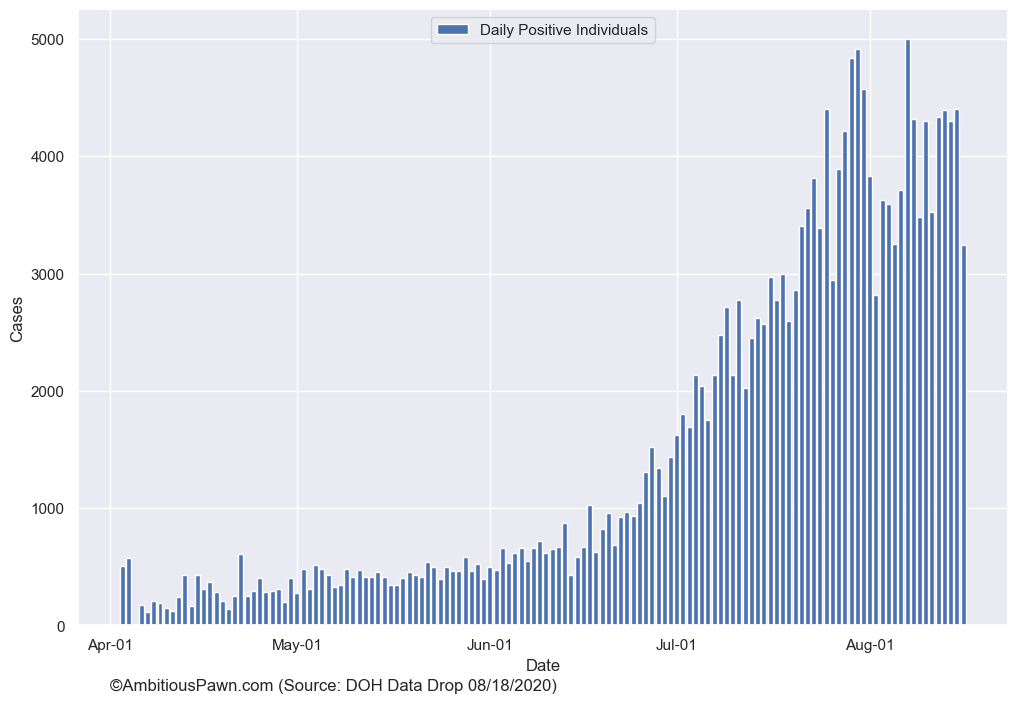
If we look closer at the plot of daily positive test results below, we can see that the number of new positive results have indeed somewhat plateaued around late July. I’m hoping that this could be a sign that the spread is slowing down, but I still would like to see the positivity rate go down.
Age Distribution of Cases and Deaths
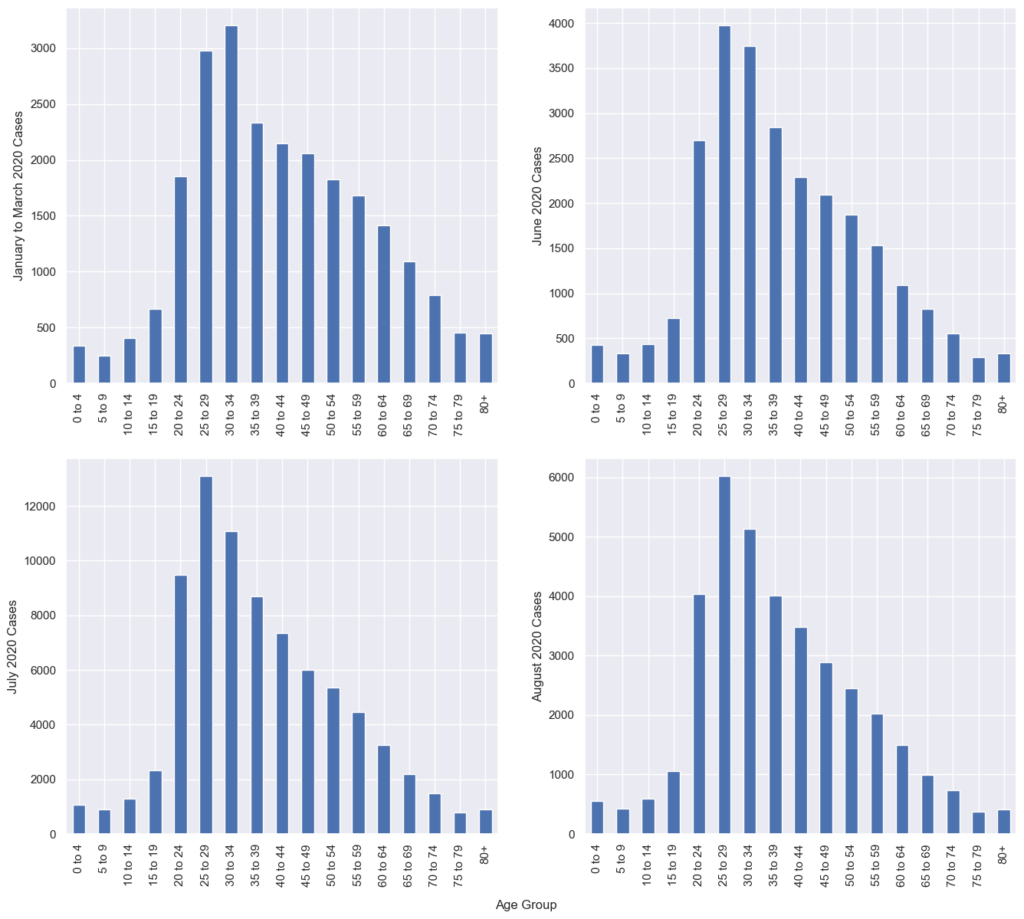
The distribution of confirmed cases over the past months have stayed almost the same, with the bulk of cases in the 25 to 34 age bracket.
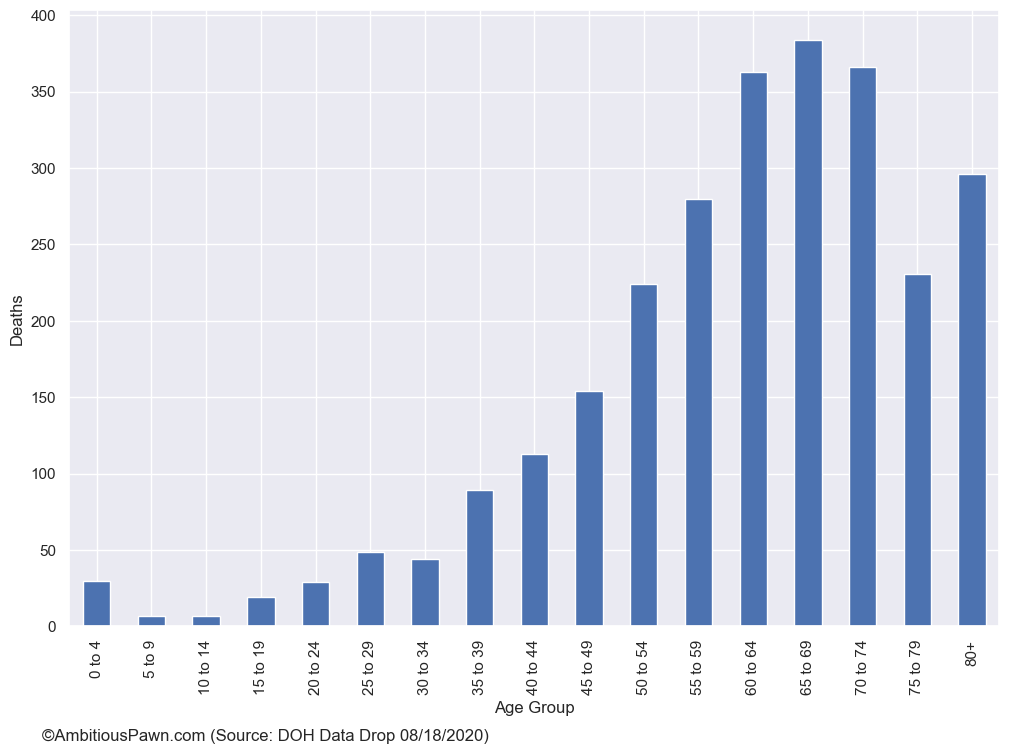
As for deaths, the distribution definitely skews towards older age brackets. Without the proper context (e.g. comorbidity), it is concerning though that we have at least 30 confirmed deaths in the 0-4 range. The US with more than 5 million cases has recorded only 26 deaths in the 0-4 range as of August 8, 2020.
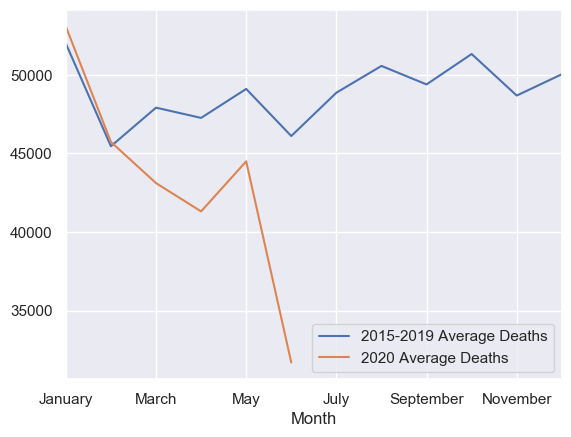
What about excess mortality?
The DOH has so far confirmed a total of 2,687 COVID-19 deaths since the pandemic began. While every death is of course unfortunate, how does this number compare to the typical all-cause death rates in the Philippines. Tracking all-cause deaths may give us an idea on whether the total number of COVID-19 deaths so far makes sense against the overall death statistics in the country. (See this Financial Times link for how they track this statistic for other countries.) The Philippine Statistics Agency recently published preliminary death statistics for the first half of 2020. So far, recorded deaths in the months of March to May are tracking below the average deaths per month from previous years. The June figure is still well below the average and this may be due to delayed reporting. If the trend holds, it would appear that deaths from COVID-19 have not yet made a significant impact on overall mortality for 2020. Obviously, it is still too early to make any conclusion based on these preliminary numbers.
Final thoughts
- We’re still probably not yet at the appropriate testing levels to be able to find cases quickly enough and to be able to lower the positivity rate.
- The DOH has to improve their validation/confirmation rate to quickly reduce the cases that are pending validation.
- Recent trends in daily new positive test numbers are encouraging but do not yet show a clear downtrend.
- The total deaths from COVID-19 has not yet caused a spike above the average death rates based on preliminary 2020 numbers.