FMETF is the only ETF available in the Philippines. It tracks the 30-component PSEi. In a previous post, I noted that FMETF is a de facto accumulating ETF, since it has never distributed any cash dividends, in spite of its declared intention to do so.
I also wondered why FMETF has to go through the hassle of issuing stock dividends instead of simply letting a higher NAVps reflect the reinvested dividends. When the stock dividends are issued, the total number of outstanding ETF shares increase. This results in the NAVps (net asset value per share) to go down. The total value of an investor’s FMETF holdings before and after the stock dividend remains the same. Every time stock dividends are issued, the market price and NAVps history of the ETF has to be split adjusted so that historical price comparisons are more accurate. This normally is a straightforward adjustment, but for some reason, maybe because of FMETF’s relative obscurity, some of the available historical pricing data on FMETF on the web are not properly split-adjusted. Below are some examples:
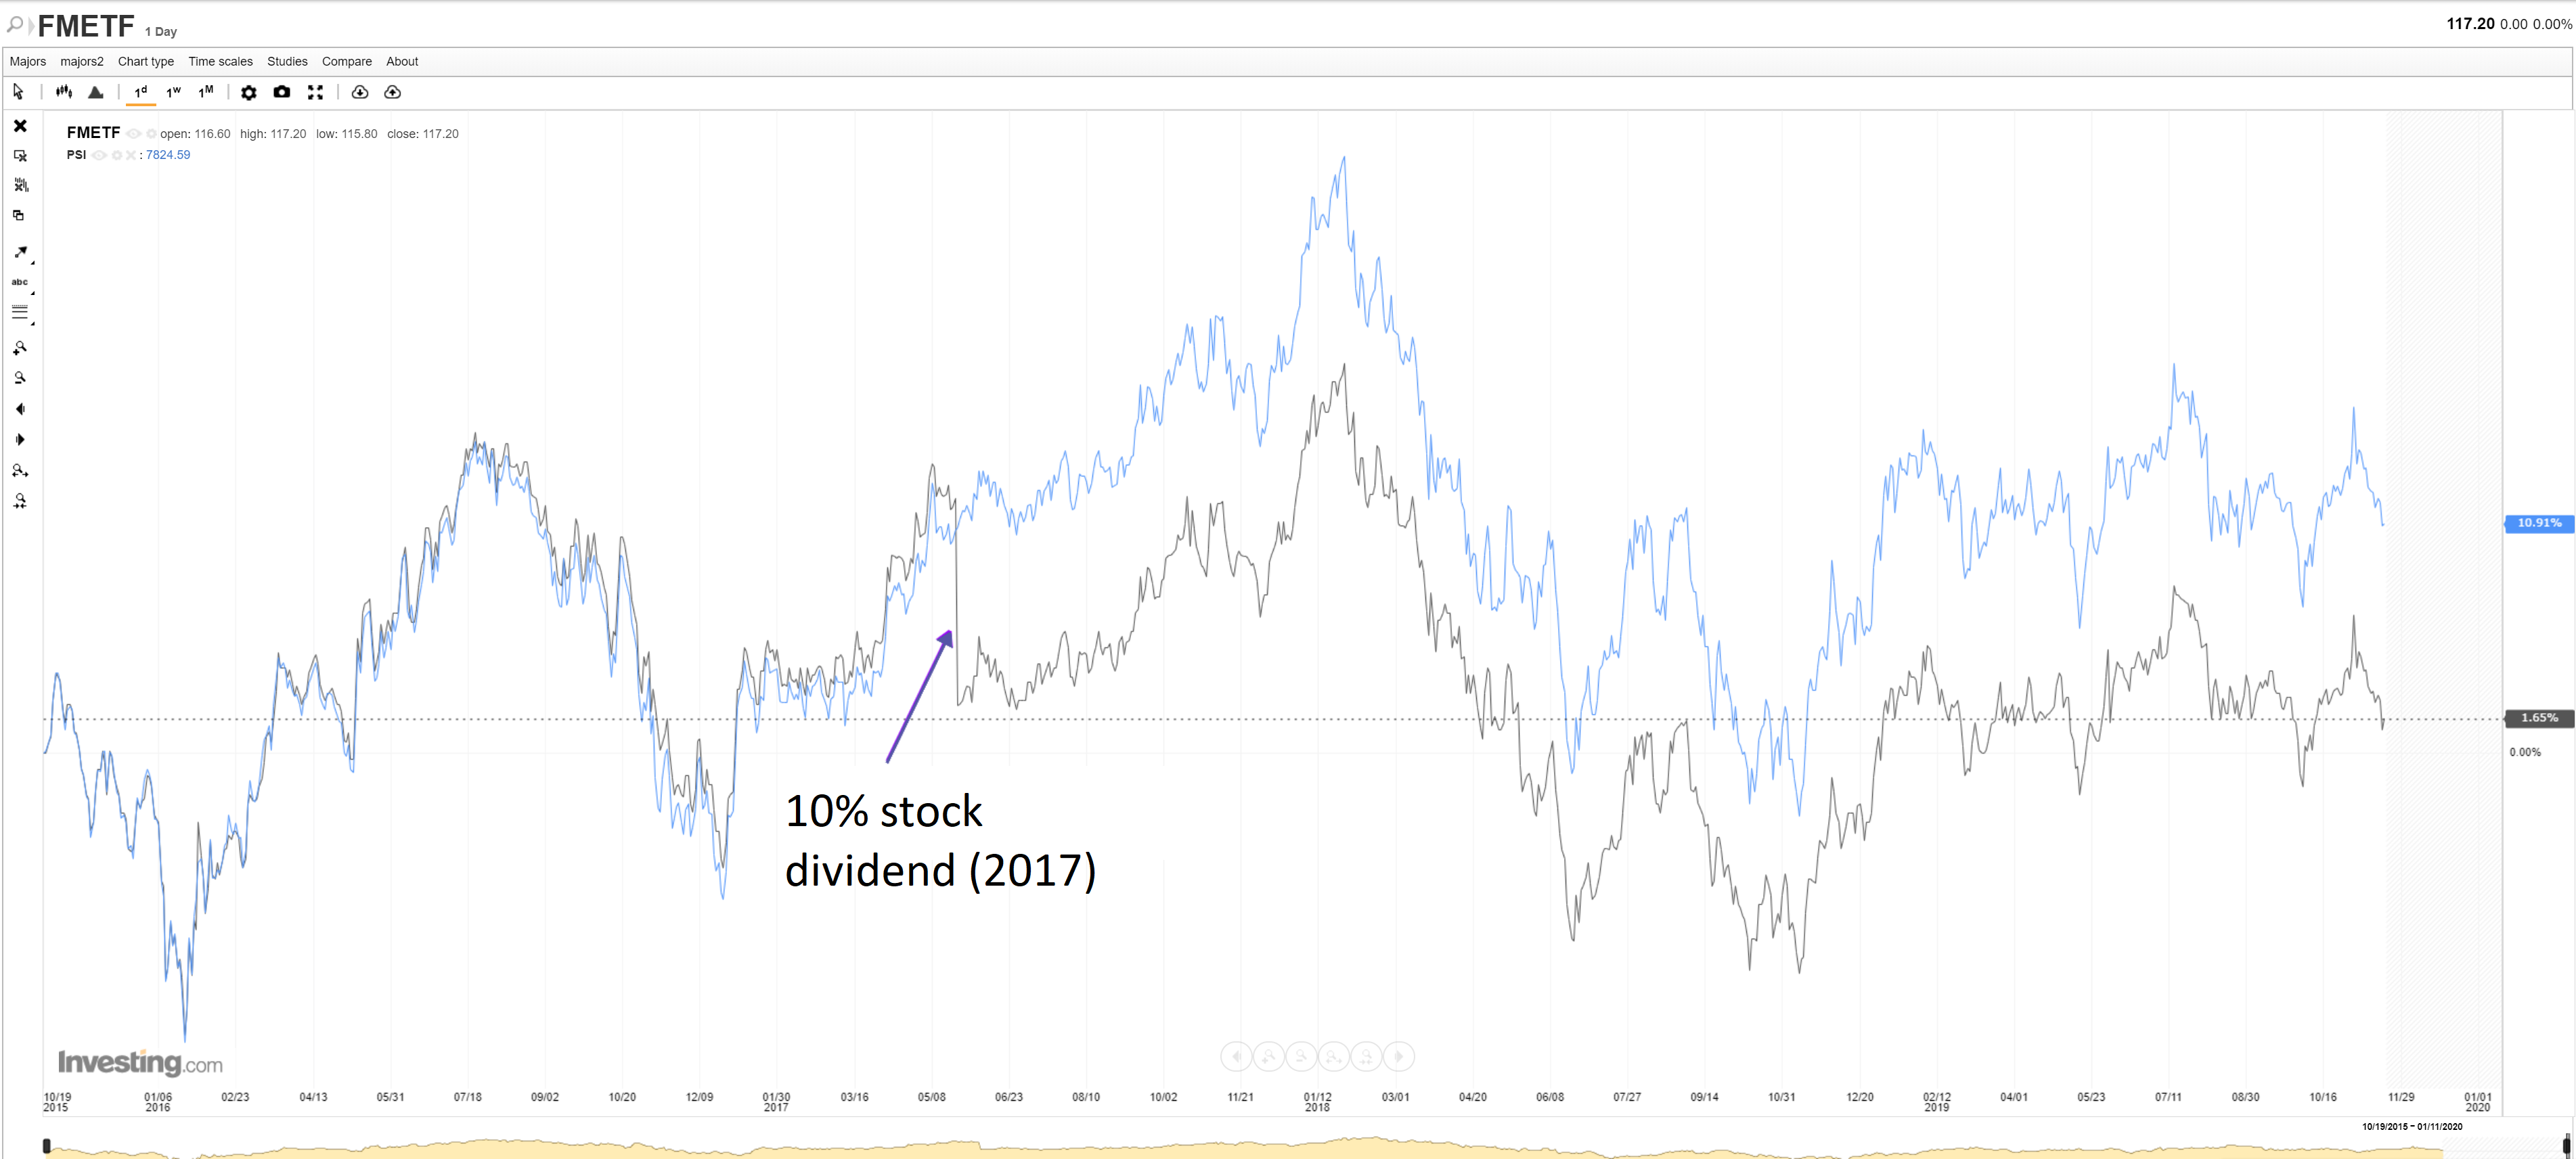
On investing.com, the FMETF price history appears to not have been split adjusted for the 2017 stock dividend, as shown by the steep drop in FMETF’s price:
On FMETF’s website itself, while the NAVps history appears to be correctly split-adjusted for both 2017 and 2018 dividends, the market price history has not been split adjusted for the 2018 stock dividend, making it appear that there’s a huge premium (3% to 5%) before the 2018 dividend.
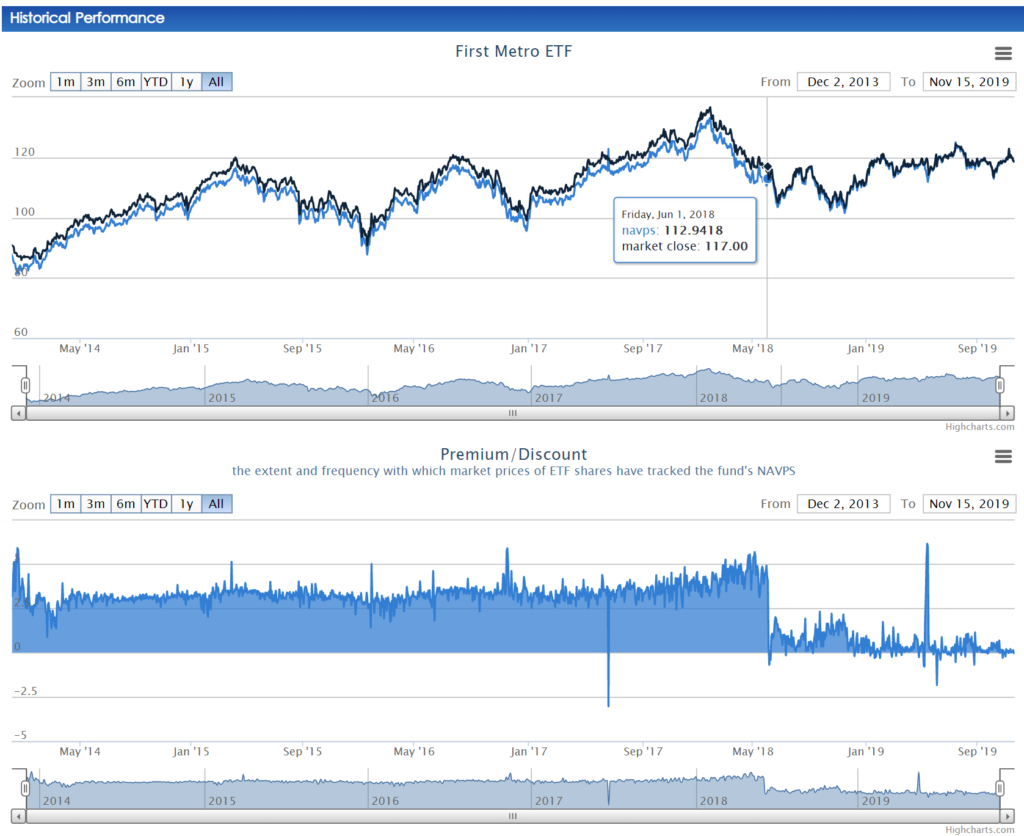
How can we be sure that it is the market price that is incorrect, and not the NAVps? To check, I looked at FMETF’s Q1 2018 report, the last report before the 2018 dividend. It says that as of March 31, 2018, the NAVps was PHP 121.2338. March 31, 2018 is Black Saturday, so the last trading day before it is March 28, 2018. On that date, the current FMETF chart shows the market price as PHP 122.60 and NAVps as 117.7089, showing that the NAVps was indeed adjusted from the previously reported value of PHP 122.60 from the Q1 2018 report.
Another easy way to confirm that the the FMETF website chart did not adjust for the 2018 stock dividend is by considering the unadjusted FMETF closing price on December 3, 2013 when it first launched. On that date, FMETF closed at 99.75. Adjusting for the 10% 2017 dividend would yield 99.75 / 1.10 = 90.68. Adjusting for the 3% 2018 dividend would yield 90.68 / 1.03 = 88.04. FMETF’s website shows the adjusted December 3, 2013 price at 90.68. The pre-2018 dividend market price history on the FMETF website has not been split-adjusted and is therefore incorrect. This is not a good look for the ETF issuer, particularly because it makes their effective growth rate from pre-2018 dividend prices look smaller. I could excuse a third party website like Investing.com for having an inaccurate split-adjusted FMETF price history, but First Metro has no excuse.
Finally, Bloomberg.com gives the following 5-year history versus PSEi:
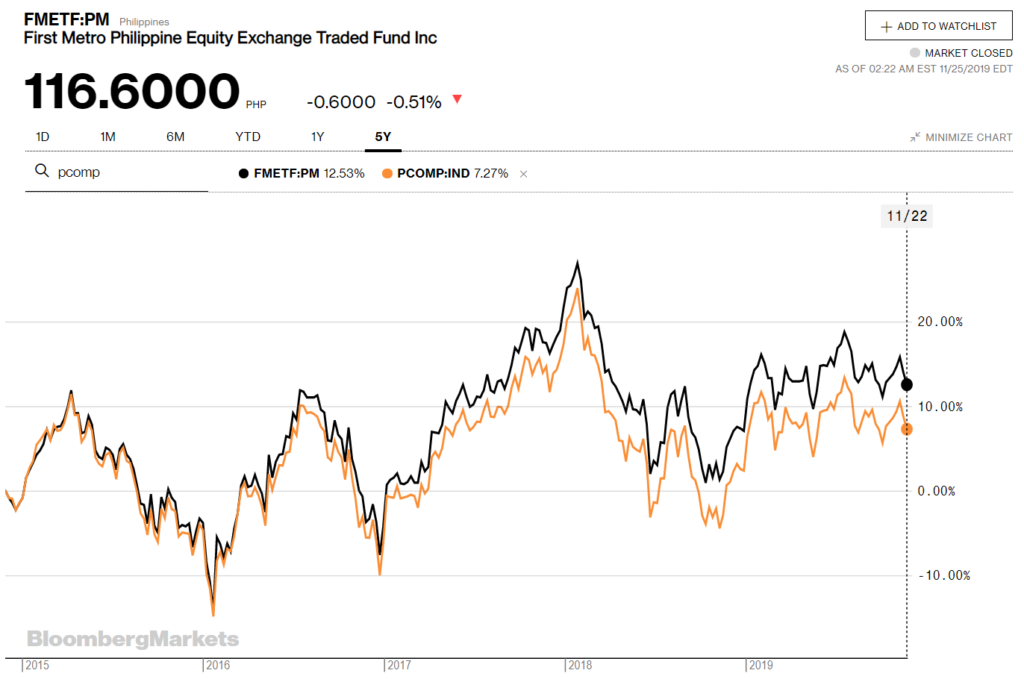
I am leaning towards trusting Bloomberg more than the others, including First Metro itself.
Just to illustrate further, here’s a table of supposedly split-adjusted market price history values before, between, and after the two stock dividends from different sources:
| date | Investing.com | firstmetroetf.com.ph | investagrams.com | bloomberg.com | |
|---|---|---|---|---|---|
| 12/09/2016 Pre-2017 dividend | 116.10 | 105.55 | 105.55 | 102.4710 | |
| 12/08/2017 Between 2017 and 2018 dividends | 125.80 | 125.80 | 125.80 | 122.1360 | |
| 12/07/2018 Post-2018 dividend | 111.50 | 111.50 | 111.50 | 111.50 |
While numbers from Investagrams.com and First Metro ETF are the same, I still maintain that their pre-2018 dividend prices have not been split-adjusted. Investing.com’s pre-2017 dividend price differ from the two as expected. Note than the pre-2018 dividend values on Bloomberg.com can easily be calculated from the pre-2018 values from the First Metro website by simply dividing the First Metro values by 1.03 (3% dividend). Bloomberg’s chart shows the correct split-adjusted numbers.
Summary
- After every stock dividend, historical market price history and NAVps has to be adjusted for the split.
- Publicly available split-adjusted price history data from the likes of Investing.com, Investagrams.com, and First Metro itself appear to be inaccurate.
- Bloomberg.com is the best source for correctly calculating returns for FMETF.
One more thing…
After writing up this blog post, I decided to check the FMETF chart on the PSE website:
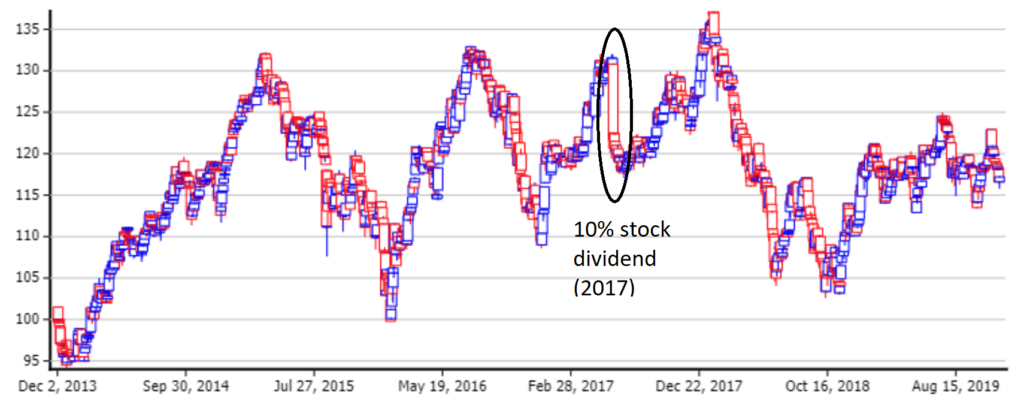
It’s also obviously not split-adjusted as it shows the same steep drop for the 2017 stock dividend as seen in the Investing.com chart. So, don’t depend on the PSE website FMETF price history to correctly calculate FMETF yield over the years.
Thanks for review in FMETF, I’m interested now in investing in it.